
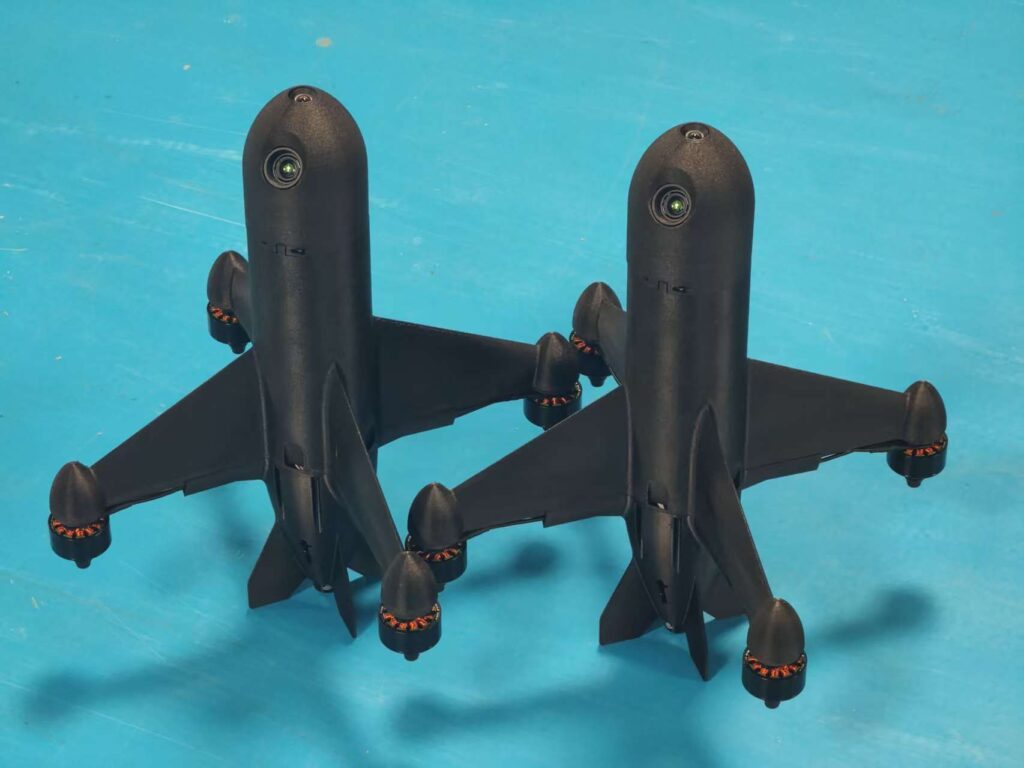
When I saw that the speed listed in the specifications table was 110 m/s, my first reaction certainly wasn’t to be surprised by that number.
I would grab a calculator. At 110 m/s—396 km/h—standard sea-level air produces roughly 7.4 kPa of dynamic pressure. That is a completely different aerodynamic regime from the 30–40 m/s environment where most conventional FPV hardware is comfortable. Every exposed surface starts paying for the speed: arms, motor mounts, wiring, camera housings, fasteners, antenna elements, landing structures, even the gaps between components.
Speed gets expensive very quickly. And this is where the FC-G250 specification becomes interesting, because the published numbers expose exactly the problem that plagues the High Speed FPV Drone market: manufacturers often advertise the aircraft’s most impressive number while leaving the engineering conditions required to achieve it undefined.
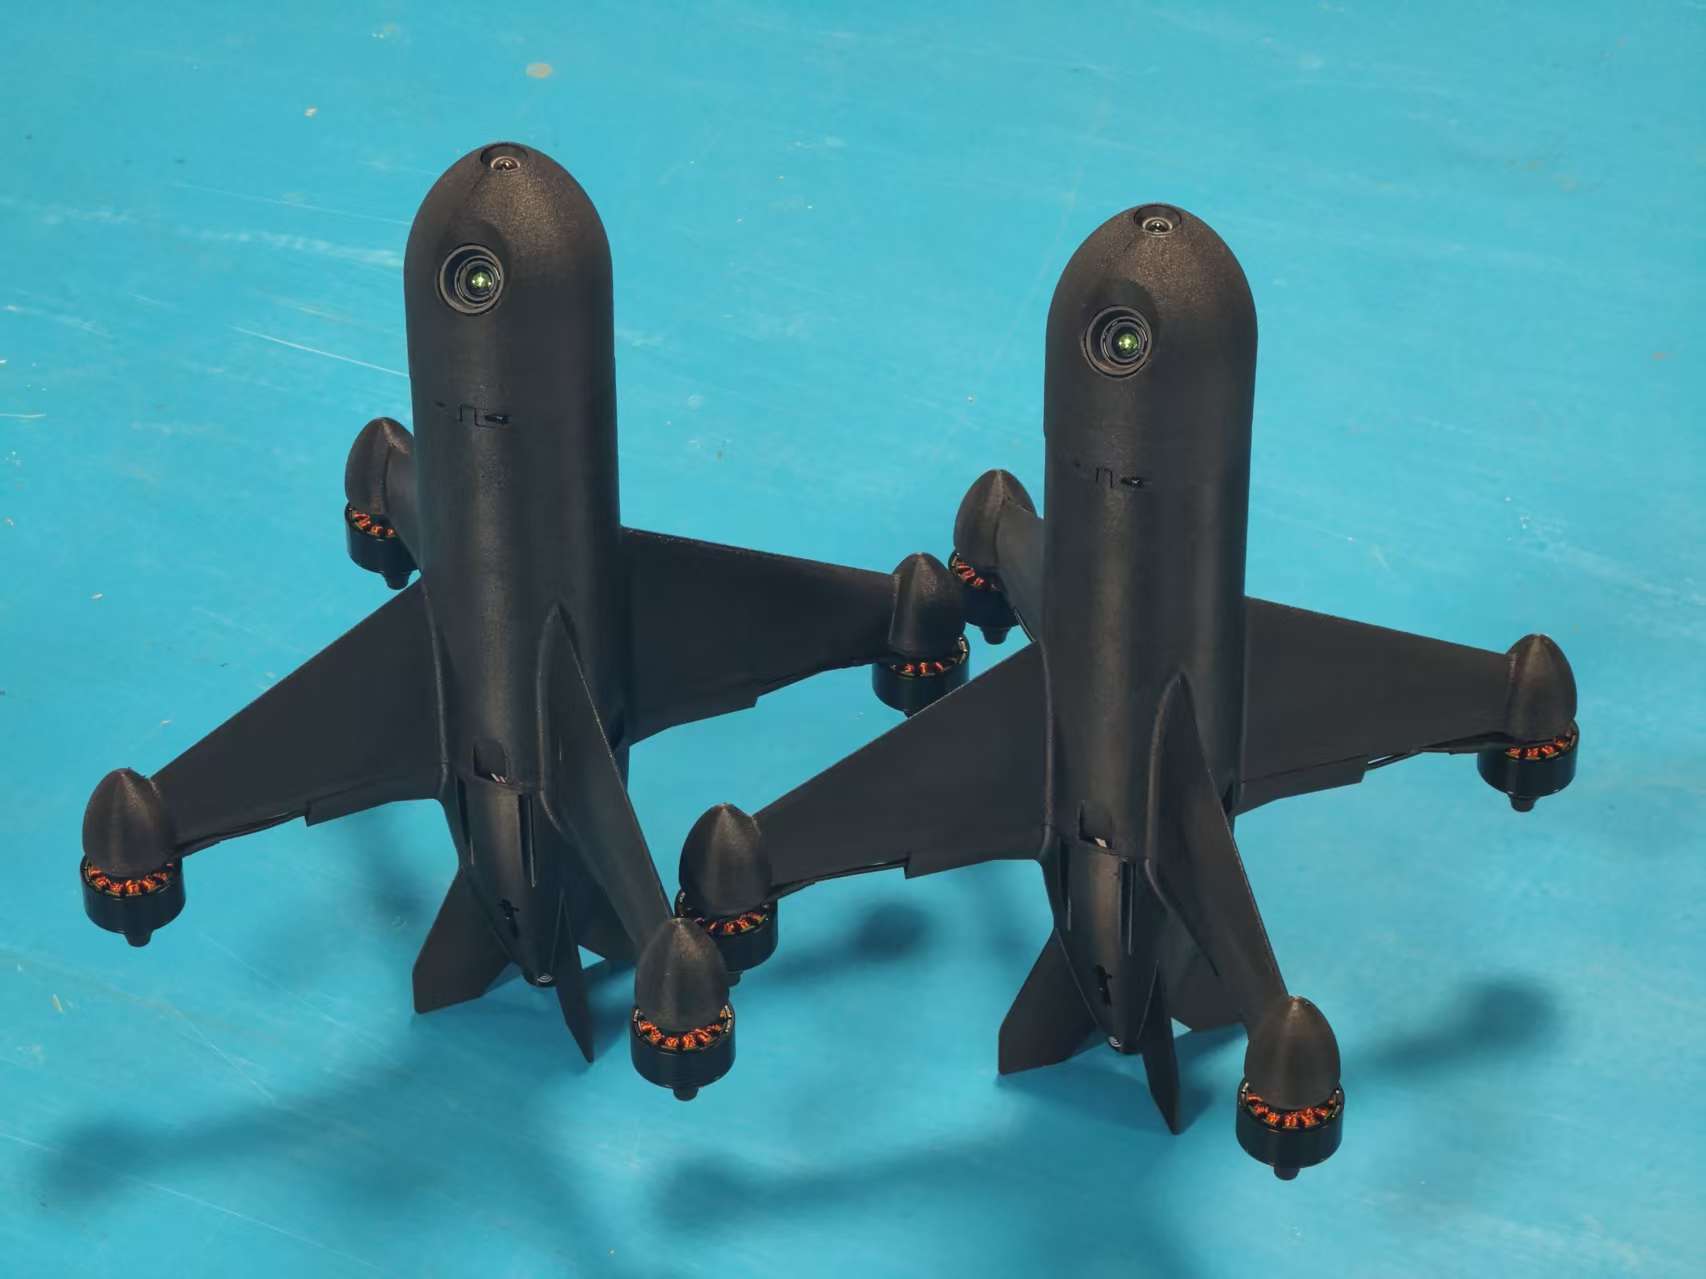
110 m/s Is Not a Small Upgrade From 100 m/s. The difference between 100 m/s and 110 m/s looks harmless on paper. It isn’t. At approximately 100 m/s, sea-level standard air produces around 6.1 kPa of dynamic pressure. At 110 m/s, that rises to approximately 7.4 kPa. That is about a 21% increase in dynamic pressure for only a 10% increase in velocity.
This is why top-speed comparisons between FPV platforms are frequently misleading. The final 10% of velocity can impose disproportionately greater structural and aerodynamic loads.
The FC-G250 therefore has a specification problem before it has a performance problem. Its documentation gives 60–100 m/s in one location and 110 m/s elsewhere. Pick one.
A serious engineering specification cannot simultaneously treat 360 km/h and 396 km/h as interchangeable values. If 110 m/s was achieved in a particular test configuration, publish the configuration: battery, payload, altitude, atmospheric conditions, propeller, flight mode and measurement method.
Otherwise the number is not a benchmark. It is a claim awaiting a test report. The 2.5 kg Payload Number Needs Much More Suspicion. Here’s where the math actually breaks down. The stated aircraft net weight is 450 g, while the stated maximum payload is 2.5 kg. That makes the payload approximately 5.56 times the aircraft’s own stated net mass. That ratio immediately demands clarification.
It does not prove the aircraft cannot carry the payload. Payload-to-empty-weight ratios can be unusual on specialized aircraft. But the number cannot be evaluated independently from maximum takeoff mass, propulsion thrust, battery capacity, structural limits and mission conditions. A 2.5 kg payload attached to a 450 g airframe does not merely increase weight. It changes the entire aircraft.
The center of gravity moves. Motor operating points change. Propeller loading changes. Acceleration capability collapses unless enormous thrust margin exists. Structural loads increase. Battery discharge requirements rise. Flight endurance falls. The aerodynamic behavior of the payload itself becomes relevant.
And if the payload is mounted externally, frontal area matters. So a configuration capable of carrying 2.5 kg slowly is not automatically a configuration capable of carrying 2.5 kg at 110 m/s.
That distinction should be printed in bold on every serious FPV specification sheet.
The 6S Electrical System Is Sensible, But It Does Not Magically Solve the Power Problem
The FC-G250 uses a 25.2 V 6S battery architecture with an FC130 6S motor and FC65 L32 ESC. The higher system voltage has a legitimate engineering advantage.
Higher voltage means lower current. Reducing current can substantially reduce resistive losses in wiring, connectors and other conductive paths. That matters on a compact high-power aircraft. But there is an easy trap here. Lower current does not mean lower total power.
If the propulsion system demands several kilowatts, the battery, ESC, motor and connectors still have to deliver those kilowatts. A 6S architecture reduces current relative to an equivalent lower-voltage system; it does not eliminate the thermal and energy-storage problem.
The missing specification is therefore not merely battery voltage. It is battery capacity, continuous discharge capability, propulsion efficiency and actual electrical power during the claimed performance condition. Without those values, the 10-minute endurance figure has very little engineering meaning.
Ten Minutes of Flight Time Is an Incomplete Number. “Maximum flight time: 10 min.” Under what conditions? This is one of the oldest bad habits in UAV specifications. Was the aircraft unloaded? Was it hovering? Was it cruising? At what altitude? At what battery state of charge? What battery capacity? What reserve? What ambient temperature? What wind? Was the aircraft flying at 20 m/s or approaching its claimed maximum speed? Those scenarios can produce radically different endurance.
A High Speed FPV Drone has a particularly awkward relationship between endurance and velocity because aerodynamic power demand can rise rapidly with speed. The energy stored in the battery is finite; increasing speed can consume that energy at a much faster rate than the pilot intuitively expects.
So “10 minutes” should never be interpreted as “10 minutes at maximum speed.” Unless tested that way. It probably isn’t. The Carbon-Fiber Thickness Is Not Structural Proof. The airframe specification lists a 3 mm carbon-fiber body with aviation-grade aluminum arms. That sounds technical. It is not enough.
Seriously, if somebody hands me “3 mm carbon fiber” as a complete structural specification, I immediately start asking what the laminate actually is. Carbon-fiber structures are anisotropic. Their behavior depends heavily on fiber orientation, laminate schedule, resin system, panel geometry, joints and load introduction.
A 3 mm carbon plate can be exceptionally stiff in one loading direction and relatively poor in another. Two plates with identical thickness can have very different mechanical properties. The same applies to the aluminum arms. What alloy? What wall thickness? What cross-section? How are they attached to the carbon structure? What is the fastener arrangement? Where are the stress concentrations?
At 110 m/s, the structure is not merely carrying static motor thrust. It is dealing with aerodynamic loading, vibration, propulsion-induced excitation and potentially abrupt control inputs. The joint is often more interesting than the material. A beautiful carbon plate attached through a poorly designed interface is still a poorly designed structure.
The C13 Gimbal Creates a Completely Different Engineering Problem. The C13 tri-sensor gimbal is where the specification becomes particularly useful as a systems-engineering case study. It combines: a 5 MP visible-light camera、a 640 × 512 thermal sensor、a 905 nm laser rangefinder、three-axis Pitch/Roll/Yaw stabilization、network control and RTSP video、target locking and AI tracking capabilities
The architecture itself makes technical sense. Three different sensing modalities answer three different questions. Visible imaging provides conventional scene information. Long-wave infrared provides thermal contrast. The laser rangefinder provides direct distance measurement. That combination is much more meaningful than simply increasing camera resolution.
But the missing specifications are more revealing than the listed ones. We do not have payload mass. We do not have power consumption. We do not have stabilization accuracy. We do not have angular travel. We do not have thermal NETD. We do not have operating temperature. We do not have actual recognition range. We do not have gimbal response characteristics.
That means the sensor package cannot yet be evaluated as an airborne system. The 640 × 512 thermal resolution is useful information. The stated approximately 1.1 km detection distance is also useful. But detection is not identification, and identification is not tracking performance. Those three terms should never be casually substituted for one another.
The Thermal Camera’s Numbers Need Context. The thermal channel operates from 8–14 μm, using a 9.1 mm F1.0 lens with a stated 48.7° × 38.6° field of view. The F1.0 aperture is particularly relevant because thermal imaging performance is strongly affected by optical throughput and detector characteristics.
But without NETD or equivalent sensitivity data, resolution alone tells only part of the story. A 640 × 512 thermal sensor does not automatically tell you how well the system detects a low-temperature-contrast object against a complicated background. Atmospheric conditions matter. Target emissivity matters. Temperature difference matters. Distance matters. Optical transmission matters. Image-processing thresholds matter.
So the sensible statement is that the C13 provides a 640 × 512 LWIR imaging channel with a stated detection distance—not that it possesses a universal 1.1 km “recognition range.” That distinction is not semantic nitpicking. It is the difference between an engineering specification and a marketing number.
The Laser Rangefinder Is Potentially More Valuable Than Another Camera Feature. The 905 nm rangefinder covers 5–1000 m, with a stated ±1 m accuracy and a 1–5 Hz update rate. At first glance, 1–5 Hz seems slow compared with a 30 fps video stream. That is because these systems do different jobs. Video provides continuous visual information. Range measurement provides discrete distance observations.
At 1 Hz, the rangefinder produces one measurement per second. At 5 Hz, it produces five. Whether that is adequate depends entirely on aircraft velocity, target dynamics and how the flight-control or tracking system consumes the measurement. This becomes especially important on a fast aircraft. At 100 m/s, an aircraft travels approximately 20 meters between 5 Hz range updates. At 1 Hz, it travels approximately 100 meters.
That does not automatically make the rangefinder unsuitable. It does mean that anyone claiming tight real-time spatial control based on a 1–5 Hz range source needs to explain the sensor-fusion architecture. The sensor update rate cannot be evaluated in isolation. The 15 km Control Range Is Another Number That Needs Its Missing Half
The FC-G250 claims a maximum control range of 15 km in an open environment, with 915 MHz / 2.4 GHz customizable control frequencies and dual antennas. Frequency alone cannot establish range. Not remotely. A proper RF link budget requires transmitter output power, antenna gain and pattern, receiver sensitivity, cable losses, polarization, modulation characteristics, data rate and environmental conditions.
Terrain matters. Antenna orientation matters. The aircraft’s attitude matters. At long range, Fresnel-zone clearance and line-of-sight geometry become relevant. So “15 km” should be treated as a test result only if the test conditions are documented. Otherwise it is simply an unqualified maximum-range claim. Look, this is basic RF engineering. A frequency band is not a range specification.
“Level 8 Wind Resistance” Is Equally Underspecified. Wind resistance is listed as Level 8. That sounds impressive until you ask: which wind-scale definition? What sustained wind speed? What gust speed? What flight mode? What payload? What altitude? What maximum acceptable position error? Was the aircraft required to maintain heading, position, or merely remain airborne?
A wind-resistance rating without its measurement methodology is nearly useless for comparing aircraft. The same label can describe radically different test conditions. And at high speed, the interaction between aircraft velocity and ambient wind becomes even more important because the aircraft experiences relative airspeed, not simply the number reported by a weather station.
The Real Benchmark Is Not Maximum Speed. The industry has become obsessed with top speed because it is easy to film and easy to put in a headline. That is the wrong benchmark.
For a high-speed FPV platform, I would want to see a much more brutal data set: Speed versus payload. Speed versus endurance. Battery voltage versus current at cruise. Propulsion efficiency versus airspeed. Acceleration versus takeoff mass. Structural vibration versus RPM. Flight-controller tracking error at high dynamic pressure. Video latency at maximum range. RF packet-loss behavior under aircraft attitude changes. Thermal performance after sustained high-power operation. Those curves tell you what the aircraft actually is. A single maximum-speed number tells you what happened once.
The C13 and G250 Also Expose a Bigger Design Trend. Putting a sophisticated multi-sensor payload on a high-speed aircraft creates a systems problem that cannot be solved by simply adding components.
The gimbal wants mechanical stability. The aircraft wants low mass. The propulsion system wants aerodynamic cleanliness. The thermal sensor wants an unobstructed optical path. The RF system wants good antenna placement. The flight controller wants predictable inertial behavior. The battery wants thermal headroom. The structure wants stiffness.
Every subsystem starts competing for the same few hundred grams and the same electrical budget. This is where conventional commercial-drone thinking begins to fail. A payload is not a box you bolt onto an aircraft. It changes the aircraft.
If the C13’s mass, power consumption and center-of-gravity envelope are eventually published, those values should be evaluated together with the G250’s propulsion and endurance data—not as independent specifications. That is the real engineering benchmark.
The Specification Sheet Still Has Several Holes. The current data leaves several variables unresolved:
FC-G250
60–100 m/s versus 110 m/s maximum speed
2.5 kg payload without corresponding MTOW
10-minute endurance without battery capacity or payload condition
5000 m maximum altitude without test definition
15 km control range without RF link-budget parameters
Level 8 wind resistance without a stated standard
720p video without latency, bitrate or frame-rate data
“15000 m maximum image” field conflicting with the 720p specification
Carbon-fiber thickness without laminate or joint information
Propeller “5×2” without confirmed diameter/pitch convention
C13
payload mass
electrical input requirements
power consumption
operating temperature
stabilization accuracy
angular range
thermal sensitivity/NETD
actual recognition performance
gimbal response characteristics
AI-processing architecture and latency
Those omissions do not mean the hardware is bad. They mean the available evidence is insufficient to determine how good it actually is. That is a much more useful conclusion. The lazy industry benchmark asks, “How fast is the drone?”
When it comes to engineering testing, the real question isn’t simply a flight duration figure, but rather: How long can the aircraft actually fly given a specific takeoff weight, battery type, flight altitude, payload, power consumption, and prevailing atmospheric conditions? The latter question is harder to measure and harder to quantify with a neat figure, but it is the result that truly matters in practice.